Viewshed Analysis to Model Broadband Coverage
The Commonwealth of Pennsylvania is engaged in a complex and far-reaching program, overseen by the Governor's Office of Administration and the Department of Community and Economic Development, with the purpose of promoting and monitoring the availability of broadband internet services for all of its citizens. These efforts address legislative initiatives at the state and federal level which advocate the notion that broadband internet communications are an essential component of economic development in the information age and that rural areas should not be excluded from accessing this service.
One of the goals of this program is to maintain and publish a complete inventory of broadband internet services available throughout the Commonwealth including technologies such as DSL, cable, fiber as well as mobile and fixed wireless.
In spring of 2010 geographIT® was hired by Michael Baker Jr. Inc. to help augment the Commonwealth of Pennsylvania's inventory of broadband services by mapping fixed wireless broadband service areas throughout the state. The primary objective was to identify areas that would be impossible to cover with the current transmission tower infrastructure because of obstructions due to topography or large man-made structures such as tall buildings or water towers. This effort was necessary in part because the very service providers that are being monitored by the Commonwealth are also the primary source of coverage information and there were concerns about the accuracy of the data that is being provided, especially in less developed areas.
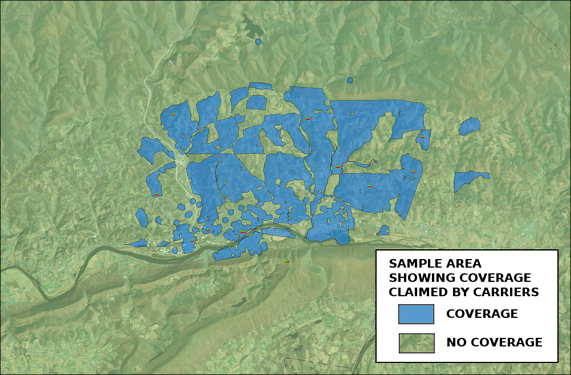
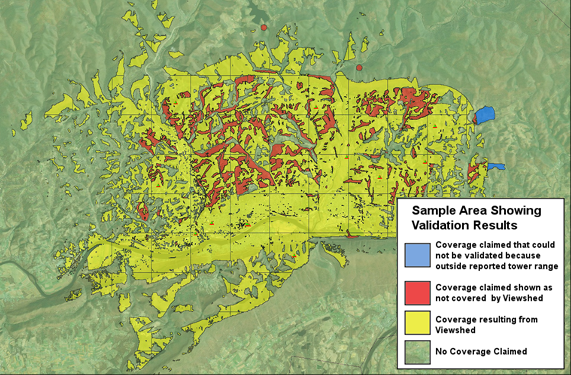
The conceptual approach was very simple: First gather source data and independently produce a wireless broadband internet coverage map, then compare this to the maps furnished by the service providers and observe the differences.
In theory the technical approach would be equally simple: Use Lidar derived high resolution Digital Elevation Models (DEMs) recently compiled through the PAMAP project and combine them with transmission tower information from the wireless service providers to generate a view-shed map. This view-shed map would essentially represent the independent wireless broadband internet coverage map and could then be compared to maps from the providers by means of a simple overlay function.
Several complicating factors became apparent even as the project specifications were being worked out:
A. The transmission tower information furnished by the service providers and passed along by the state authorities contained the horizontal location and the transmission range of the towers but not their elevation. Furthermore, getting the providers to deliver this data within the timeframe of the project seemed out of the question. Without transmission tower elevation it would be impossible to run a view-shed procedure.
B. In order for the view-shed analysis to include tall buildings and water towers, these would have to be visible in the DEMs being used, however, the finished DEMs available from the PAMAP project were strictly circumscribed to a bare earth surface, excluding all "above ground objects" such as buildings and vegetation.
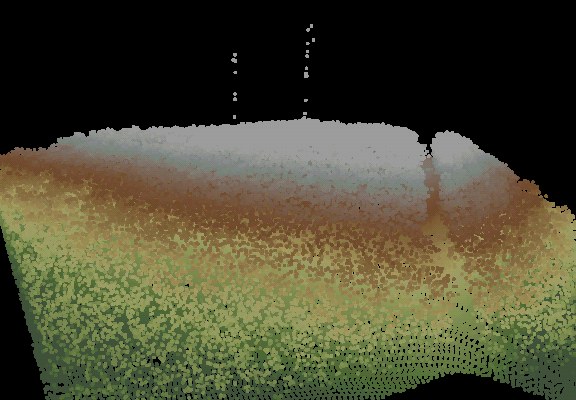
To solve these issues it was proposed to use the raw LiDAR point cloud data to attempt to model the actual transmission towers, and secondly to use that same point cloud data to build DEMs that included bare earth plus man-made structures but excluded vegetation.
This approach meant that raw LiDAR files available in .las format would have to be searched for towers as well as filtered and then converted to customized DEMs before being used in the view-shed analysis. This in turn required the development of a high performance software stack designed to batch-process roughly 3,500 raw LiDAR files, each measuring four square miles and containing up to ten million points.
Various software toolkits were evaluated in terms functionality, performance and cost effectiveness for this task. The result was a hybrid software stack consisting of tools from various sources, considered to be the best available options given the functional and budgetary constraints of the project. Within the stack the tools were sequenced by means of python scripts designed to repetitively process all 3,500 LiDAR files. Each tool performed a specific task receiving a data input, processing it and producing a data output, which in turn was passed to the next tool as an input. The following tools were used:
A. A custom binary parser written in "C", capable of filtering raw LiDAR .las files based on their internal attribute structure (which includes information such as return number, return intensity and terrain class) and producing a new filtered .las file. This approach was taken after it was determined that available tools either did not perform as necessary or were too expensive for this project. The results amply justified the extra investment providing the ability to filter a 200MB file containing more than 10 million points in around 5 seconds.
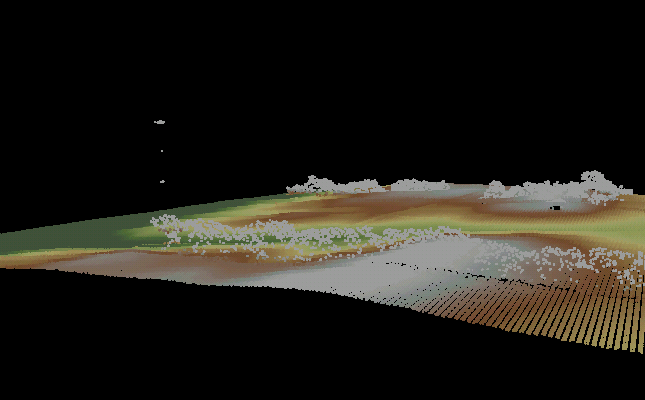
B. A "ground filtering tool" produced from command line utilities included in the public domain Fusion software suite, maintained by the US Department of Forestry. This was used primarily as a pre-processing step meant to remove noise and redundant points before generating a DEM. A fair amount of experimentation was required in order to tune the input parameters determining the aggressiveness of the point removal algorithm. This tool was modified further when it was found that LiDAR files often capture birds in flight.
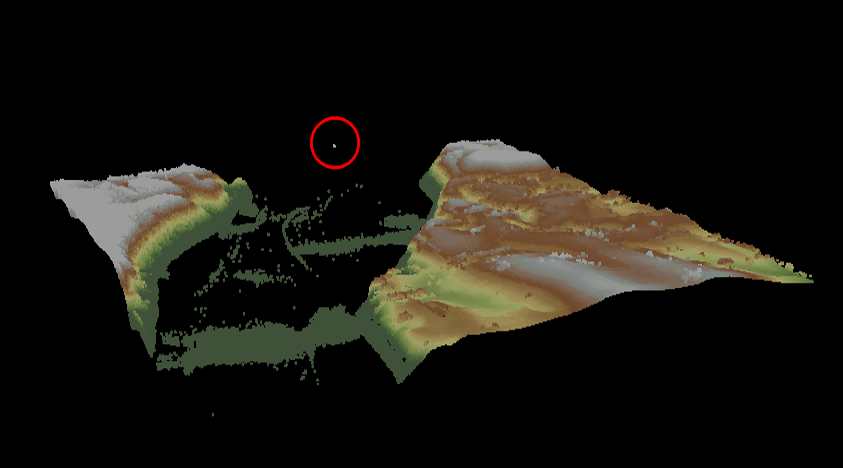
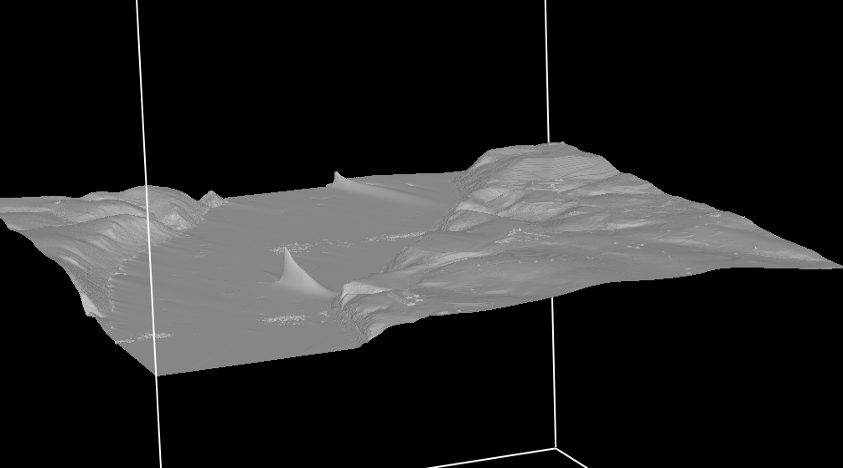

If birds were captured flying above bodies of water the ground filtering tool would not remove all of them. In some cases it would create spurious tent-like structures, which would then cast shadows and result in erroneous view-shed datasets. The solution consisted of clipping "above water" Lidar points with NHD water-body polygons. This was implemented by adding a filtering step and using the Fusion "GIS Clip" utility.
C. A "DEM creating tool", also derived form the public domain Fusion software suite. This created a raster based DEM for each LiDAR tile.
D. A "DEM aggregation tool". This aggregated all of the DEMs, representing LiDAR tiles within the range of one transmission tower, into one continuous raster surface implemented as a raster dataset within an ESRI file based geo-database. As a result an aggregate DEM was created for each transmission tower. This was neatly integrated into the stack by using python based ArcGIS (ESRI) geo-processing tools.
E. Tool to search for the highest point within a specified radius around a given transmission tower's horizontal location. This procedure was applied to un-filtered LiDAR .las files and was implemented as a modification of the original filtering program written in "C". Instead of filtering by attributes this procedure filters by x-y location.
F. Tool to run view-shed analysis for each individual transmission tower. This was implemented using ESRI geo-processing tools including the Spatial Analyst extension and produced raster datasets where pixels where either "in" or "out" of the view-shed. This computation included parameters to account for the curvature of the earth, as well as for refractive bending of electromagnetic waves through the atmosphere.
G. Tool to vectorize the view-shed raster datasets into polygon feature classes and aggregate these into a state-wide polygon feature class. This was also implemented using ESRI geo-processing tools. Note that the decision not to perform state-wide aggregation of the data until after completing vectorization was deliberate. It was adopted because running the preceding geo-processing routines on one large state-wide raster dataset would have resulted in significantly degraded performance.
This automated software stack is now ready to be re-used if and when new transmission tower and/or LiDAR data become available, allowing the re-mapping of wireless broadband internet coverage areas at a significantly lower cost.
The fact that the methodology is automated also makes it possible to perform tests with different sets of input parameters, allowing the evaluation of different scenarios, possibly improving the modeling of the DEMs or more accurately modeling the wireless wave propagation characteristics.